IELTS Writing Task 1 pie chart: how to compare proportions
Describe IELTS Task 1 pie charts accurately: grouping segments, fractions and percentages, comparing two or more charts, and a sample overview.
By English Grader study guides · AI-assisted educational content · Official sources linked below
The short answer
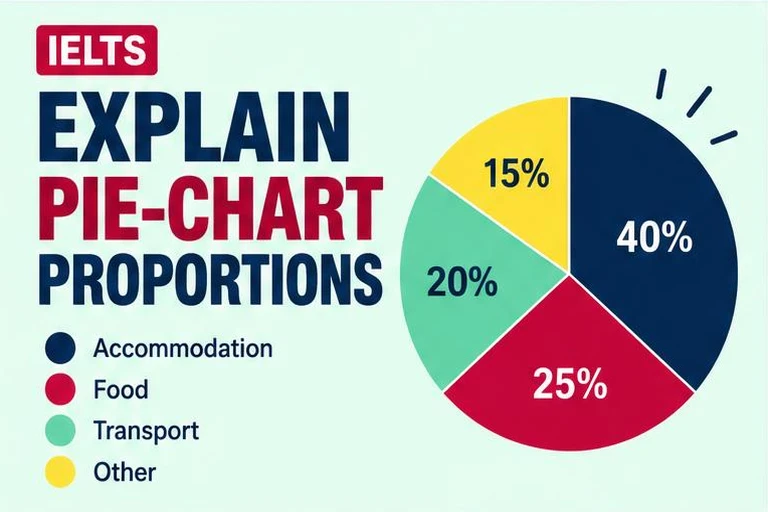
Use a mix of percentages and fractions, group small segments, and compare charts rather than describing each one separately.
Vary how you express proportions
- 25% → a quarter
- just over 50% → slightly more than half
- the majority / a small minority
- accounted for / made up
Two pie charts? Compare them
When charts show two years, describe what grew and what shrank between them instead of writing one paragraph per chart.
Related guide: Describing change over time
Sample overview
Overview
Overall, coal's share of electricity production fell considerably between 2000 and 2020, while renewable sources grew to become the largest single category.
Put this into practice
Review useful IELTS vocabulary before applying it to your own pie-chart practice.
Guest AI tries are limited to one use per feature per day. Sign in for saved progress. AI feedback and band estimates are practice guidance, not official IELTS results.
Official sources and further reading
Practice examples and study routines are illustrative advice, not official band-scored answers or predictions of exam questions.