IELTS Writing Task 1 mixed charts: how to describe two visuals in one report
A clear method for IELTS Task 1 questions with two charts—grouping data, writing one overview, and linking the visuals without listing numbers.
By English Grader study guides · AI-assisted educational content · Official sources linked below
The short answer
Write one overview that covers both visuals, then give each chart its own body paragraph and link them where the data connects.
What a mixed-chart task looks like
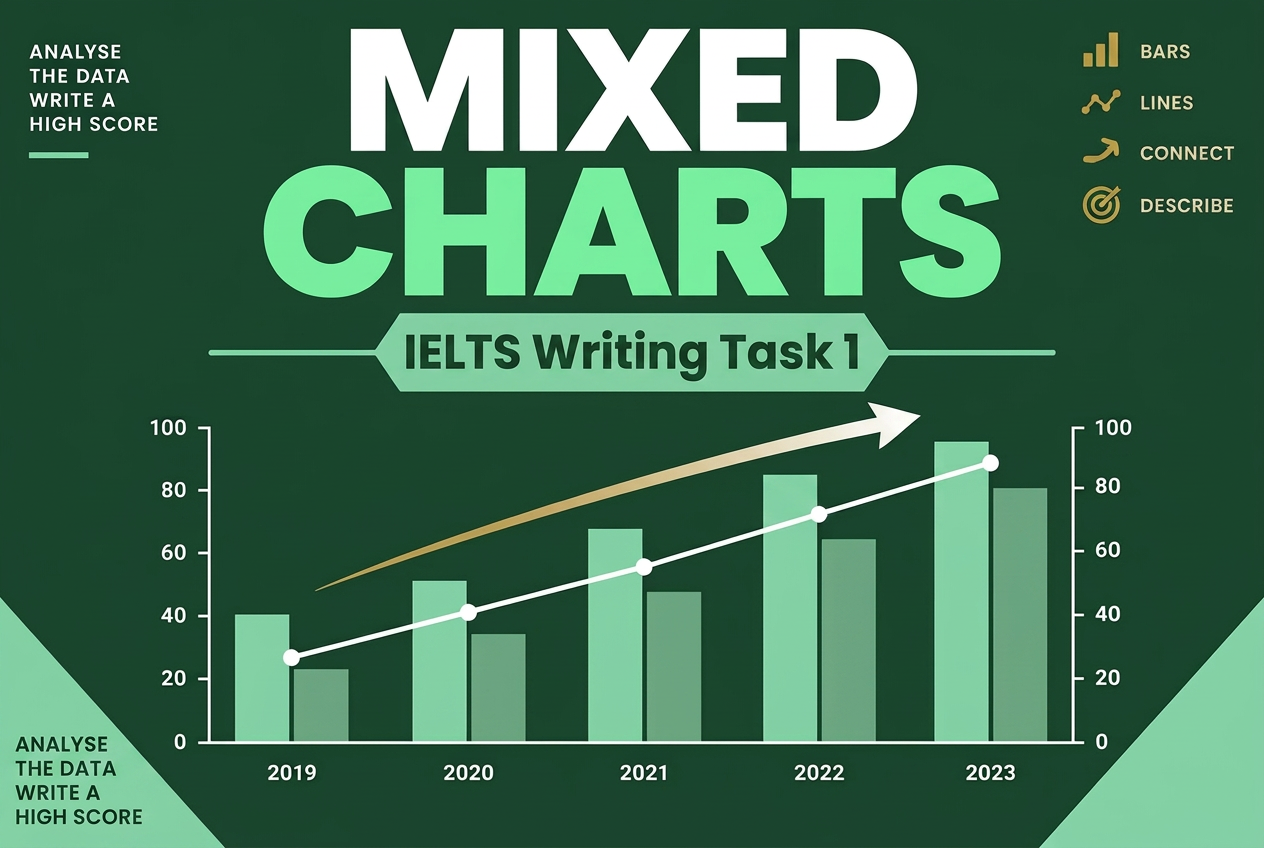
You may get a line graph with a table, a pie chart with a bar chart, or two pie charts for different years. The visuals are always related—your job is to show how.
Related guide: Review the basic chart method
A four-paragraph structure
Keep it simple and stay near 170–190 words.
- Introduction: paraphrase what both visuals show
- Overview: the main feature of each visual in two sentences
- Body 1: key figures from the first chart
- Body 2: key figures from the second chart, linked back to the first
Sample overview
Notice that it mentions both visuals without any numbers.
Overview
Overall, car use rose steadily over the period, while the table shows that this was accompanied by a sharp fall in bus passengers, particularly in rural areas.
Practise with feedback
Write a report, then check whether your feedback says the overview covered both visuals.
Get Task 1 feedback →Put this into practice
Choose a mixed-chart question from the Task 1 bank or upload your own, write your report, and get feedback checked against the data.
Guest AI tries are limited to one use per feature per day. Sign in for saved progress. AI feedback and band estimates are practice guidance, not official IELTS results.
Official sources and further reading
Practice examples and study routines are illustrative advice, not official band-scored answers or predictions of exam questions.