
IELTS Writing Task 1 feedback for teachers: check the chart before the grammar
Teach IELTS Writing Task 1 with chart-based feedback, accurate data checks and focused revisions using the question bank or a custom uploaded visual.
By English Grader study guides · AI-assisted educational content · Official sources linked below
The short answer
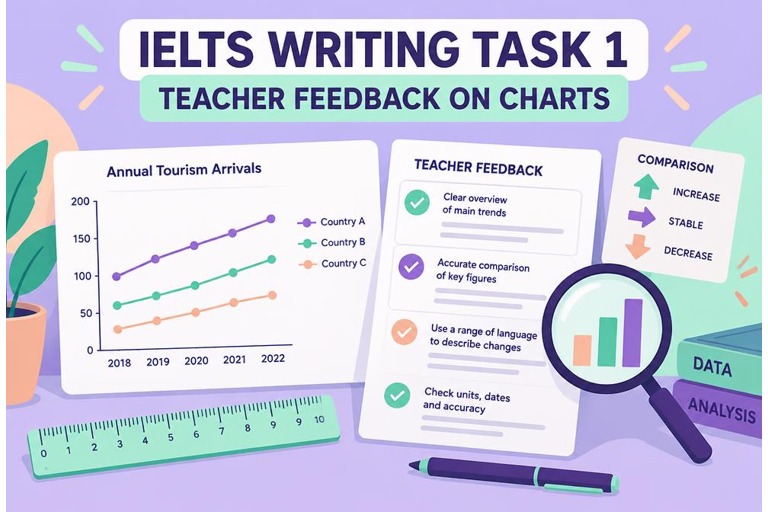
Task 1 marking starts with the visual. Check the overview, selection and accuracy of key features before polishing individual sentences.
Keep the actual visual with the report
A fluent report can still describe the wrong trend. Before marking, identify the chart title, units, dates, categories and biggest changes. Compare the student's claims directly with that source, rather than assuming the chart matches a familiar textbook example.
English Grader's Task 1 practice area separates the question bank from custom questions. Teachers can explore original bank tasks by visual type, or practise with a custom uploaded chart. When using your own image, check that the displayed question and image refer to the same task.
Choose a bank task or custom Task 1 visual →Assess Task Achievement before language
Academic Task 1 requires a report of at least 150 words, with about 20 minutes recommended. Assessment includes Task Achievement, Coherence and Cohesion, Lexical Resource, and Grammatical Range and Accuracy. Task Achievement concerns coverage and accuracy, not whether the student used impressive adjectives.
Look for an overview of the main features, appropriate supporting details and comparisons where relevant. Do not encourage explanations of causes that the visual does not supply. A chart showing rising tourism does not prove why the rise occurred.
- Does the overview identify the main pattern or changes?
- Are labels, values and units reported accurately?
- Are important features selected rather than every number listed?
- Are comparisons supported by the visual?
Give a data-specific revision instruction
Replace 'add more detail' with a precise action. Ask the student to compare two categories, correct the unit or identify the main contrast. Check the revised sentence against the chart before discussing its style.
Illustrative feedback for an invented classroom chart
The chart shows rail use rising from 20% to 35%, while bus use falls from 40% to 25%. Your overview says both rose. Rewrite it to contrast the two directions, then use the start and end figures as support.
Related guide: Teach accurate Task 1 overviews
Use one visual for several short activities
Before assigning a full report, ask students to write an overview, choose two useful comparisons and group the data into body paragraphs. These short tasks expose misunderstandings quickly and give you less writing to review at once.
The 20-minute practice timer can support a later timed response. Generate Band 6.0 and 7.0 example answers for comparison only after students have attempted the task, so the examples do not become a script to copy.
Practise Task 1 reports and example answers →Keep visual checking in the teacher's hands
AI can misread a small label or infer a feature that is not present. Verify any numerical correction or model answer against the visual. If an image is too small to read confidently, obtain a clearer version before asking students to trust the analysis.
Practice feedback is not an official IELTS score. Use the tool to organise diagnosis and revision, while retaining your own judgement about the response and task.
Put this into practice
Choose a chart type or upload your own task, then use a report and its feedback to build a focused classroom activity.
Guest AI tries are limited to one use per feature per day. Sign in for saved progress. AI feedback and band estimates are practice guidance, not official IELTS results.
Official sources and further reading
Practice examples and study routines are illustrative advice, not official band-scored answers or predictions of exam questions.